Friday, 12 June 2020

Exadata: IMPX vs Smart Scans

Starting 11.2, Oracle introduced a new feature called In-Memory parallel execution. This allows parallel slaves to do full segment scans via the buffer cache (and not via direct path reads). Note that this feature is not related to the 12c database in-memory option.On the face of it, it appears to be a nice little feature that allows you to cache a big table across the buffer cache of all RAC instances. But on Exadata, your query will not take advantage of smart scans, storage indexes, column projections because these features need direct path read as a prerequisite.

So, the next question that immediately comes to mind is – which is better? A parallel query doing buffered reads or a parallel query doing smart scans. Let’s get started with a little demo. IMPX kicks in when parallel_degree_policy is set to AUTO and the segment size is between 2-80% of the global buffer cache. There could be other heuristics and algorithms that impacts Oracle decision to use direct reads or buffered reads. 

In this set up, I’ve a table T of size 26 GB. I’m on an Exadata X7 machine, using a 3 node RAC. Each node has buffer cache size of 20 GB. Therefore, global buffer cache size is 60 GB. Database version is 11.2.0.4

Scenario 1 : parallel_degree_policy is set to MANUAL. IMPX does not kick in. 

SQL> SELECT /*+ PARALLEL(8) */ COUNT(*) FROM T ;

This SQL has a wall clock time of 1 second. Looking at the execution stats

SELECT
inst_id,
elapsed_time / 1e6,
       executions,
       buffer_gets,
       disk_reads,
       ROUND(physical_read_bytes / 1024 / 1024 / 1024,2) physical_read_gb,
       ROUND(IO_CELL_OFFLOAD_ELIGIBLE_BYTES / 1024 / 1024 / 1024,2) IO_CELL_OFFLOAD_ELIGIBLE_GB,
       ROUND(IO_INTERCONNECT_BYTES / 1024 / 1024 / 1024,2) IO_INTERCONNECT_GB,
       ROUND(IO_CELL_UNCOMPRESSED_BYTES/1024/1024/1024,2) IO_CELL_UNCOMPRESSED_GB,
       ROUND(100*(IO_CELL_OFFLOAD_ELIGIBLE_BYTES -
IO_INTERCONNECT_BYTES)/IO_CELL_OFFLOAD_ELIGIBLE_BYTES,2) IO_SAVED_PERC
  FROM gv$sql
    WHERE sql_id = 'aavvpznpcf8b7'
 ORDER BY 1


** Click on the image to have clear view.

As you can see, total disk reads is about 26 GB. And almost all of it is eligible for offloading.
IO_SAVED_PERC is at 99%. This indicates that a smart scan has taken place. Only a few MBs of data was transferred back from the cell server to the database compute node. 
This explains why the SQL was so quick. This is the hardware capability of Exadata. Its ability to scan 26 GB of data at cell server in less than a second. AWSOME ! Isn't it ?

Scenario 2parallel_degree_policy is set to AUTO. IMPX kicks in.

SQL> alter system set parallel_degree_policy=AUTO SCOPE=BOTH SID='*' ;

Now we run the same select again. 

SQL> SELECT /*+ PARALLEL(8) */ COUNT(*) FROM T ;

Now the SQL wall clock time went up drastically from 1 second to 8 minutes and 45 seconds.
Here are the execution stats


IO_CELL_OFFLOAD_ELGIBLE_BYTES is now 0. And around 26 GB of data has been sent back from the cell server to the database compute node. It was a buffered read, smart scans did not take place. Let's look at V$BH to see if the blocks has been cached across all the RAC instances.

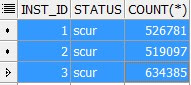
SELECT inst_id, status, COUNT (*)
FROM gv$bh
WHERE objd = 66837983 AND status != 'free'
GROUP BY inst_id, status
ORDER BY 2 DESC


T


These are the number of blocks cached on each of the instances in scur mode.
Adding the number of blocks - 1680263. Multiplied by DB Block size of 16KB- I get 26 GB.
Oracle has now uniformly cached the entire table in the buffer cache of instance 1,2,3. Each instance caches around 8 GB of data blocks. This was done using cell multiblock physical reads (and not via cell smart scans). This explains why this execution took more than 8 minutes. It had to read 25 GB of data from the storage, transfer it to the compute nodes and cache it onto the instance buffer cache. This is certainly an overhead for the first execution.
Now let's run the same SQL again. Hoping that this time, Oracle would read the data from the global buffer cache.

SQL> SELECT /*+ PARALLEL(8) */ COUNT(*) FROM T ;

And yes, second execution of this SQL completes in 1 second. Looking at the stats


No smart scans here as io_cell_offload_eligible_bytes is 0. But disk reads and physical reads  bytes has come down to 0. Because Oracle can now find all the block it needs in the buffer cache of instance 1,2,3. Another important point to note here is that the PX servers do not use cache fusion to transfer blocks between nodes. It is also possible to see one instance doing direct path reads and other instance(s) going for buffered reads. 

To summarise this behaviour, IMPX is not really useful on Exadata environments because it prevents the use of smart scans and storage indexes. Queries that benefits a lot from smart scans will most likely suffer from parallel buffered reads. Moreover, the global database cache is still limited in size, couple of big tables in a warehouse environment can easily fill up 80% of the cache and then Oracle will start to trash the cache. That's again a huge overhead. 
In my opinion, AUTO parallel degree policy is like a beast in the cage. It makes your database vulnerable to IMPX, parallel statement queuing and as a DBA you are never in complete control ! It is best to have the policy set to MANUAL specially for large warehouse databases on Exadata environments.  

Tuesday, 28 April 2020

Various methods of Partition Pruning and DML restrictions

Partition Pruning is an optimization technique that the optimizer applies to eliminate certain partitions during query execution. In this article we will discuss about various methods of Partition Pruning and certain pruning restrictions that apply to Insert As Select ( IAS) statements.

Let's get started with a test case. We create two tables T1 and T2. T1 is non partitioned.
T2 is a partitioned table. Partitioned by HASH on the partition_id column.

CREATE TABLE T1 ( event_name VARCHAR2(254) , partition_id NUMBER);

CREATE TABLE T2
(
    partition_id      NUMBER,
    partition_name    VARCHAR2 (254)
)
PARTITION BY HASH (partition_id)(PARTITION p1,
 PARTITION p2,
 PARTITION p3,
 PARTITION p4);

Now we run a SELECT statement with different hints and examine the execution plans and look at the different types of partition pruning Oracle uses.

BLOOM PRUNING


EXPLAIN PLAN FOR
SELECT /*+ USE_HASH(T2) */ * FROM T1,T2 where 
T1.event_name like 'str%'
and T1.partition_id=T2.partition_id

Plan hash value: 2384829105

--------------------------------------------------------------------------------------------------------
| Id  | Operation                    | Name    | Rows  | Bytes | Cost (%CPU)| Time     | Pstart| Pstop |
--------------------------------------------------------------------------------------------------------
|   0 | SELECT STATEMENT             |         |  5000 |   976K| 11158   (1)| 00:03:33 |       |       |
|*  1 |  HASH JOIN                   |         |  5000 |   976K| 11158   (1)| 00:03:33 |       |       |
|   2 |   JOIN FILTER CREATE         | :BF0001 |     1 |   100 |     4   (0)| 00:00:01 |       |       |
|   3 |    PART JOIN FILTER CREATE   | :BF0000 |     1 |   100 |     4   (0)| 00:00:01 |       |       |
|*  4 |     TABLE ACCESS STORAGE FULL| T1      |     1 |   100 |     4   (0)| 00:00:01 |       |       |
|   5 |   JOIN FILTER USE            | :BF0001 |   100K|  9765K| 11154   (1)| 00:03:32 |       |       |
|   6 |    PARTITION HASH JOIN-FILTER|         |   100K|  9765K| 11154   (1)| 00:03:32 |:BF0000|:BF0000|
|*  7 |     TABLE ACCESS STORAGE FULL| T2      |   100K|  9765K| 11154   (1)| 00:03:32 |:BF0000|:BF0000|
--------------------------------------------------------------------------------------------------------

Predicate Information (identified by operation id):
---------------------------------------------------

   1 - access("T1"."PARTITION_ID"="T2"."PARTITION_ID")
   4 - storage("T1"."EVENT_NAME" LIKE 'str%')
       filter("T1"."EVENT_NAME" LIKE 'str%')
   7 - storage(SYS_OP_BLOOM_FILTER(:BF0001,"T2"."PARTITION_ID"))
       filter(SYS_OP_BLOOM_FILTER(:BF0001,"T2"."PARTITION_ID"))

Here a bloom filter is created at O/P 3. And at O/P 7, Pstart and Pstop is :BF0000.
Based on this bloom filter partition pruning occurs on T2 and therefore, only the partitions containing the relevant data are scanned.This is called Bloom Pruning.
This is controlled by the hidden parameter _bloom_pruning_enabled which defaults to TRUE
At O/P 2 we see JOIN FILTER CREATE, this is a join filter which also relies on bloom filters but this does not eliminate partitions. This is another sort of optimization and not to be confused with bloom pruning. You can read about the bloom filter here.


KEY KEY PRUNING


EXPLAIN PLAN FOR
SELECT /*+ USE_NL(T1) */ * FROM T1,T2 where 
T1.event_name like 'str%'
and T1.partition_id=T2.partition_id

Plan hash value: 2185522821

----------------------------------------------------------------------------------------------------
| Id  | Operation                   | Name | Rows  | Bytes | Cost (%CPU)| Time     | Pstart| Pstop |
----------------------------------------------------------------------------------------------------
|   0 | SELECT STATEMENT            |      |  5000 |   976K|  2792   (1)| 00:00:54 |       |       |
|   1 |  NESTED LOOPS               |      |  5000 |   976K|  2792   (1)| 00:00:54 |       |       |
|*  2 |   TABLE ACCESS STORAGE FULL | T1   |     1 |   100 |     4   (0)| 00:00:01 |       |       |
|   3 |   PARTITION HASH ITERATOR   |      | 10000 |   976K|  2788   (1)| 00:00:53 |   KEY |   KEY |
|*  4 |    TABLE ACCESS STORAGE FULL| T2   | 10000 |   976K|  2788   (1)| 00:00:53 |   KEY |   KEY |
----------------------------------------------------------------------------------------------------

Predicate Information (identified by operation id):
---------------------------------------------------

   2 - storage("T1"."EVENT_NAME" LIKE 'str%')
       filter("T1"."EVENT_NAME" LIKE 'str%')
   4 - storage("T1"."PARTITION_ID"="T2"."PARTITION_ID")
       filter("T1"."PARTITION_ID"="T2"."PARTITION_ID")

With Nested Loop joins, the execution plan has completely changed. There are no bloom filters here.
All rows of T1 are scanned. And for each of these partition_id's Oracle can now prune into a specific partition on T2. Pstart and Pstop shows as KEY-KEY. If T1 returns 10 records with same partition ids - then the same partition on T2 is scanned 10 times. This kind of pruning is bad if T1 returns lot of rows.

SUBQUERY PRUNING


ALTER SESSION SET "_bloom_pruning_enabled"=FALSE
ALTER SESSION SET "_bloom_filter_enabled"=FALSE

EXPLAIN PLAN FOR
SELECT /*+ USE_HASH(T2) SUBQUERY_PRUNING(T2 PARTITION) */ * FROM T1,T2 where 
T1.event_name like 'str%'
and T1.partition_id=T2.partition_id

Plan hash value: 2405306729

----------------------------------------------------------------------------------------------------
| Id  | Operation                   | Name | Rows  | Bytes | Cost (%CPU)| Time     | Pstart| Pstop |
----------------------------------------------------------------------------------------------------
|   0 | SELECT STATEMENT            |      |  5000 |   976K| 11158   (1)| 00:03:33 |       |       |
|*  1 |  HASH JOIN                  |      |  5000 |   976K| 11158   (1)| 00:03:33 |       |       |
|*  2 |   TABLE ACCESS STORAGE FULL | T1   |     1 |   100 |     4   (0)| 00:00:01 |       |       |
|   3 |   PARTITION HASH SUBQUERY   |      |   100K|  9765K| 11154   (1)| 00:03:32 |KEY(SQ)|KEY(SQ)|
|   4 |    TABLE ACCESS STORAGE FULL| T2   |   100K|  9765K| 11154   (1)| 00:03:32 |KEY(SQ)|KEY(SQ)|
----------------------------------------------------------------------------------------------------

Predicate Information (identified by operation id):
---------------------------------------------------

   1 - access("T1"."PARTITION_ID"="T2"."PARTITION_ID")
   2 - storage("T1"."EVENT_NAME" LIKE 'str%')
       filter("T1"."EVENT_NAME" LIKE 'str%')

We have disabled bloom pruning here. With Hash joins, Oracle now goes for Subquery Pruning. At O/P 3 you will see Partition Hash Subquery. T1 is fully scanned. Now Oracle runs a recursive query on TBL$OR$IDX$PART$NUM to discover what partitions it will need from T2. Based on the result of that recursive query, T2 is pruned. Pstart and Pstop is KEY(SQ) KEY( SQ) 
This is controlled by the parameter _subquery_pruning_enabled.

INSERT AS SELECT and BLOOM PRUNING


EXPLAIN PLAN FOR
INSERT /*+ APPEND */  INTO T3
SELECT /*+ USE_HASH(T2) */ * FROM T1,T2 where 
T1.event_name like 'str%'
and T1.partition_id=T2.partition_id

Plan hash value: 1934473477
-----------------------------------------------------------------------------------------------------
| Id  | Operation                    | Name | Rows  | Bytes | Cost (%CPU)| Time     | Pstart| Pstop |
-----------------------------------------------------------------------------------------------------
|   0 | INSERT STATEMENT             |      |  5000 |   976K| 11158   (1)| 00:03:33 |       |       |
|   1 |  LOAD AS SELECT              | T3   |       |       |            |          |       |       |
|*  2 |   HASH JOIN                  |      |  5000 |   976K| 11158   (1)| 00:03:33 |       |       |
|*  3 |    TABLE ACCESS STORAGE FULL | T1   |     1 |   100 |     4   (0)| 00:00:01 |       |       |
|   4 |    PARTITION HASH ALL        |      |   100K|  9765K| 11154   (1)| 00:03:32 |     1 |     4 |
|   5 |     TABLE ACCESS STORAGE FULL| T2   |   100K|  9765K| 11154   (1)| 00:03:32 |     1 |     4 |
-----------------------------------------------------------------------------------------------------
Predicate Information (identified by operation id):
---------------------------------------------------
   2 - access("T1"."PARTITION_ID"="T2"."PARTITION_ID")
   3 - storage("T1"."EVENT_NAME" LIKE 'str%')
       filter("T1"."EVENT_NAME" LIKE 'str%')

In 11.2.0.4 Oracle does not consider bloom pruning for Insert As Select statements. 
Looking at the plan Pstart -> Pstop is 1 and 4. All partitions of T2 are being scanned. This could cause major performance issues when you have tens of thousands of partitions in T2.
This restriction has been lifted on 18.1. One workaround would be to use CTAS instead if IAS.
CTAS allows bloom pruning. 

You can now request backport for fix 16609749 on 11.2.0.4. This enables bloom pruning for direct path insert as selects. Note that this fix is not enabled by default. You need to explicitly enable this 

ALTER SESSION SET "_fix_control" = '16609749:ON';

EXPLAIN PLAN FOR
INSERT /*+ APPEND */  INTO T3
SELECT /*+ USE_HASH(T2) */ * FROM T1,T2 where 
T1.event_name like 'str%'
and T1.partition_id=T2.partition_id


Plan hash value: 3019913043
---------------------------------------------------------------------------------------------------------
| Id  | Operation                     | Name    | Rows  | Bytes | Cost (%CPU)| Time     | Pstart| Pstop |
---------------------------------------------------------------------------------------------------------
|   0 | INSERT STATEMENT              |         |  5000 |   976K| 12379   (1)| 00:03:31 |       |       |
|   1 |  LOAD AS SELECT               | T3      |       |       |            |          |       |       |
|*  2 |   HASH JOIN                   |         |  5000 |   976K| 12379   (1)| 00:03:31 |       |       |
|   3 |    JOIN FILTER CREATE         | :BF0001 |     1 |   100 |     4   (0)| 00:00:01 |       |       |
|   4 |     PART JOIN FILTER CREATE   | :BF0000 |     1 |   100 |     4   (0)| 00:00:01 |       |       |
|*  5 |      TABLE ACCESS STORAGE FULL| T1      |     1 |   100 |     4   (0)| 00:00:01 |       |       |
|   6 |    JOIN FILTER USE            | :BF0001 |   100K|  9765K| 12375   (1)| 00:03:31 |       |       |
|   7 |     PARTITION HASH JOIN-FILTER|         |   100K|  9765K| 12375   (1)| 00:03:31 |:BF0000|:BF0000|
|*  8 |      TABLE ACCESS STORAGE FULL| T2      |   100K|  9765K| 12375   (1)| 00:03:31 |:BF0000|:BF0000|
---------------------------------------------------------------------------------------------------------
Predicate Information (identified by operation id):
---------------------------------------------------
   2 - access("T1"."PARTITION_ID"="T2"."PARTITION_ID")
   5 - storage("T1"."EVENT_NAME" LIKE 'str%')
       filter("T1"."EVENT_NAME" LIKE 'str%')
   8 - storage(SYS_OP_BLOOM_FILTER(:BF0001,"T2"."PARTITION_ID"))
       filter(SYS_OP_BLOOM_FILTER(:BF0001,"T2"."PARTITION_ID"))

And BLOOM ....!

Friday, 24 April 2020

System Statistics on Exadata and its impact on Optimizer cost

In this post I will discuss about the Exadata mode system statistics and how this impacts the cost of a full table scan.
Let's get started with the test case. I'm running this test case on an Exadata machine with database version 18.1

SQL> create table T (ID number) segment creation immediate ;

I don't want to insert a lot of rows, so I just fudge the statistics.

SQL> exec dbms_stats.set_table_stats(user,'T',numrows=>50000,numblks=>50000);

Optimizer now believes that this table has 50000 rows and 50000 blocks.
I currently  have NOWORKLOAD statistics 

FLAGS 0
CPUSPEEDNW 3326
IOSEEKTIM 10
IOTFRSPEED 4096
SREADTIM
MREADTIM
CPUSPEED
MBRC

FLAGS set to 0 indicate No Workload statistics. Note that SREADTIM and MREADTIM is not set. They are derived from IO Seek time and IO transfer speed. MBRC is also not set, it is derived from the parameter db_file_multiblock_read_count. Note that this parameter has been explicitly set to 64 on my database ( Why did I use the word "explicitly" - will explain that in some other post).
Now let's see the plan

SQL> explain plan for 
                                select * from T;

Plan hash value: 1601196873
----------------------------------------------------------------------------------
| Id  | Operation                 | Name | Rows  | Bytes | Cost (%CPU)| Time     |
----------------------------------------------------------------------------------
|   0 | SELECT STATEMENT          |      | 50000 |   634K| 14857   (1)| 00:00:02 |
|   1 |  TABLE ACCESS STORAGE FULL| T    | 50000 |   634K| 14857   (1)| 00:00:02 |
----------------------------------------------------------------------------------

Cost of this full table scan is 14857. 
We will see how Oracle computes the cost

Cost = IO Cost + CPU Cost

IO Cost of FTS = (Blocks/MBRC) * (MREADTIME/SREADTIM)

Blocks = 50000
MBRC = 64
SREADTIM = IOSEEKTIME + DB_BLOCK_SIZE/IOTFRSPEED
                     = 10 + 16384/4096
                     = 14 
MREADTIM =IOSEEKTIME + (MBRC*DB_BLOCK_SIZE) / IOTFRSPEED
                      = 10 + (64*16384)/4096
                      = 266
Cost of FTS = (50000/64) * ( 266/14)
                    = 14843 

14843 is the IO cost. Very close to 14857 which we see in the execution plan. The difference is the CPU cost which is very minimal here.

Now let's gather the statistics in Exadata Mode and compute the numbers again

SQL> exec dbms_stats.gather_system_stats('EXADATA')

These are my new values now

FLAGS
1
CPUSPEEDNW 3326
IOSEEKTIM 13
IOTFRSPEED 204800
SREADTIM
MREADTIM
CPUSPEED
MBRC 64

FLAGS set to 1 indicate workload statistics. Now let's compute the cost of FTS

Blocks = 50000
MBRC = 64
SREADTIM = IOSEEKTIME + DB_BLOCK_SIZE/IOTFRSPEED
                     = 13 + 16384/204800
                     = 13.08
MREADTIM =IOSEEKTIME + (MBRC*DB_BLOCK_SIZE) / IOTFRSPEED
                      = 13 + (64*16384)/204800
                      = 18.12
Cost of FTS = (50000/64) * ( 18.12/13.08)
                    = 1082

Let's look at the plan to see if our calculations are correct

SQL> explain plan for 
                                select * from T;

Plan hash value: 1601196873
----------------------------------------------------------------------------------
| Id  | Operation                 | Name | Rows  | Bytes | Cost (%CPU)| Time     |
----------------------------------------------------------------------------------
|   0 | SELECT STATEMENT          |      | 50000 |   634K|  1095   (2)| 00:00:01 |
|   1 |  TABLE ACCESS STORAGE FULL| T    | 50000 |   634K|  1095   (2)| 00:00:01 |
----------------------------------------------------------------------------------

Yes. Our calculations look correct. Plan shows 1095 and we calculated the value to be 1082. Difference is the CPU cost.

FTS cost dropped from 14843 to just 1082 .Fact that Exadata is a powerful hardware and that has to be accounted in the cost. Full table scans are much faster on Exadata and therefore the cost of FTS should be much lesser. This is why you must gather system statistics in Exadata mode.


Thursday, 16 April 2020

Oracle is running truncates against your tabes but don't worry


Oracle never fails to surprise me. And this time it was running truncate statements against my tables.

Oracle introduced dbms_space_admin.drop_empty_segments in 11.2. This enables us to drop unused space within a segment. In other words, this procedure will defragment a table. But why would it issue truncate against the tables that has data ?
Let's get started with a test case

SQL> create table T1 (A number) ;

Since DEFERRED_SEGMENT_CREATION is set to TRUE, segment for T1 is never created.

SQL> create table T2 (A number);
SQL> insert into T2 values (1);
SQL> commit;

My insert statement has created a segment because of the insert.

SQL> create table T3 (A number) ;
SQL> insert into T3 values (1);
SQL> commit;
SQL> delete from T3;
SQL> commit;


SQL> select table_name, segment_created from user_tables ;
T1     NO
T2    YES
T3    YES

T3 is the table that is fragmented. I inserted a row and then deleted it. So, I have some free space below the HWM. And drop_empty_segments procedure should take care of this.
Now lets run the procedure

SQL> execute dbms_space_admin.drop_empty_segments('SCOTT') ;

10046 trace of the above procedure shows that Oracle recursively ran the following SQLs

LOCK TABLE T2 IN EXCLUSIVE MODE NOWAIT
TRUNCATE TABLE T2
LOCK TABLE T3 IN EXCLUSIVE MODE NOWAIT
TRUNCATE TABLE T3

It locked tables T2 and T3 in exclusive mode. and then ran truncates against them.
But why was a truncate issued against T2 ? This table has data in it. And not even eligible for segment drop.


SQL> select table_name, segment_created from user_tables ;
T1     NO
T2    YES
T3    NO

As you can see, We have reclaimed the free space in T3 and segment_created has been set to NO.
But surprisingly, truncate was issued against T2 as well. I ran a select on T2, data wasn't actually truncated.
As per bug notes, this truncate is actually a no-op truncate. This is a special form of truncate. This truncate first checks if the segment has rows or not and then decides whether to truncate the segment.
But it still holds an exclusive lock on T2 which can cause major performance bottleneck. If T2 is a huge table with thousands of partitions, Oracle might take too long to probe each of these partitions to check if a row exists or not. And while this probe is on, any other session trying to insert a row into this table would wait for enq- TM contention.
Therefore, I'd never suggest running this procedure. There are other better ways to defrag a table.

Sunday, 29 March 2020

Fine Grained Cursor Invalidation on 18c

In the previous post we discussed about parallel query cursor invalidation and ORA 12842. In 11.2.0.4 we had a hard time dealing with cursor invalidation error and serial downgrade. We had to choose between one of the two evils.

In Oracle Database 12.2, we have a new feature called fine grained cursor invalidation. This is controlled by a new parameter cursor_invalidation. Prior to 12.2, cursors were invalidated immediately after a DDL was issued. This DDL could be any of the partition maintenance operations such as move partition, truncate partition or a partition exchange. But with 12.2 Oracle does not invalidate them immediately. Rather, we now have a set of rules based on individual cursor dependencies which decides whether a cursor should be invalidated immediately or deferred.

Here is a small test case to demonstrate the problem on 11.2

/*PREPARE the test table*/

--DROP TABLE TMP_TN2;

CREATE TABLE TMP_TN2
(
    ID    NUMBER
)
PARTITION BY LIST (ID)(PARTITION P_1 VALUES (1), PARTITION P_2 VALUES (2));

BEGIN
  INSERT INTO tmp_tn2
  SELECT /*+parallel(8)*/
                 1
          FROM dba_objects t1,
               dba_objects t2,
               dba_objects t3
          WHERE ROWNUM < 100000000;
  COMMIT;
END;
/
/* START QUERY IN SESSION 1 */

DECLARE
  lv_c NUMBER;
BEGIN
  dbms_output.put_line('START');

  SELECT SUM(c)
  INTO lv_c
  FROM
  (
    SELECT /*+ PARALLEL(4)*/
           COUNT(1) c
    FROM tmp_tn2 partition(P_1) t1,
         tmp_tn2 partition(P_1) t2,
         tmp_tn2 partition(P_1) t3
    UNION ALL
    SELECT /*+ PARALLEL(4)*/
           COUNT(1) c
    FROM tmp_tn2 partition(P_1) t1,
         tmp_tn2 partition(P_1) t2,
         tmp_tn2 partition(P_1) t3
    WHERE ROWNUM < 1000000
  );
    
END;
/

/* INVALIDATE CURSOR IN SESSION 2. Let this run until session 1 fails with ORA 12842  */


BEGIN
  WHILE(TRUE)
  LOOP
      EXECUTE IMMEDIATE 'ALTER TABLE TMP_TN2 TRUNCATE PARTITION P_2';
      dbms_lock.sleep(5);
   END LOOP;
END;
/

In 11.2, first session fails with ORA 12842. But on my 18c database my first session never fails.
Now the optimizer is much more intelligent, it realizes that the current cursor is accessing only one partition P_1. And truncate of P_2 from second session will not affect the existing cursor in anyway. Therefore that is not invalidated. Hence avoiding ORA 12842 or serial downgrade.

Note that add and drop partition would still invalidate the cursors because it changes the partition number. Instead of a drop, it is better to exchange or truncate the partition.

Tuesday, 7 January 2020

ORA- 942 despite having the select privilege

Here is an intriguing issue where a user was able to run a SQL statement directly or from within an anonymous PL SQL Block. But the same SQL statement fails with ORA 942 - table or view does not exist, when it is run from within a procedure.

User A was able to execute this
CREATE TABLE A.TEST AS SELECT * FROM B.TEST ;
User A was also able to execute this
BEGIN
EXECUTE IMMEDIATE 'CREATE TABLE A.TEST AS SELECT * FROM B.TEST';
END;
/
But the same user A was not able to execute this procedure.
CREATE PROCEDURE A.TEST_PROC
AS
BEGIN
EXECUTE IMMEDIATE 'CREATE TABLE A.TEST AS SELECT * FROM B.TEST';
END;
/
-- Procedure created
EXECUTE TEST_PROC;

This fails with ORA 942 - table or view does not exist. User A has select privilege on B.TEST via a role!
Oracle allows two modes of operation for executing named PL SQL - definer rights and invoker rights. By default all procedures and functions are created with definer rights. In this definer rights model, all roles are disabled during procedure compilation and execution. We were able to compile the above procedure because B.TEST is within the execute immediate block. But during the execution of this procedure, the role is disabled and therefore User A looses the access on B.TEST.
Hence, the procedure execution fails with ORA 942. Even a call to SET ROLE is not allowed within the procedure. You must remove the role dependency and give direct grants to the user, to be able to run the above procedure.
With invoker rights model, roles are enabled for PL SQL execution but not during compilation. 


Saturday, 7 September 2019

Curious case of SQLs restarting by itself and ORA -12842

We might have seen lots of ORA-12842 "Cursor Invalidated during parallel execution".
Usually a select query running in parallel would fail with this error. This can happen when the select is running concurrently with other sessions doing some sort of partition maintenance ( like exchange partitions or adding / dropping partitions). Well, this is an expected behaviour. Document 1322894.1 tells you to ignore this error and re-execute the query. Or you can just "suppress" the error message by setting a fix control.

SQL> alter system set "_fix_control"='7170213:OFF' ;


But the note doesn't tell you about how Oracle actually suppresses the error. And is it really a good idea to set this fix control ?

Let's try and understand the current database behaviour. If a parallel query encounters ORA 12842 midway during the execution, the error is not immediately reported back to the user. Instead, Oracle silently restarts the SQL on its own hoping that it will go through this time. If this "automated" second run also fails with the same error, Oracle again restarts the SQL. And this continues. If the 10th execution is unsuccessful, only then ORA 12842 is reported back to the user.

Now, if I have a select query that should complete in 15 minutes. Let's say this fails after running for first 10 minutes and then Oracle restarts the query all over again. Assuming that all retry attempts were unsuccessful, this query would effectively run for 100 minutes and then report ORA 12842.
And if the query succeeds in the 10th attempt, the total run time for this query would appear to be 105 minutes! So, the user might complain that his query is running slow but actually Oracle is silently restarting the query in the background. In the ASH data you would see that the sql_exec_id would change after every failure.

Now let's talk about how Oracle suppresses this error. When we turn off this fix control, ORA 12842 is never reported. But there is a catch to it. With the fix control turned off, Oracle does not retry the SQL for 10 times ( as explained above). Instead, it downgrades the SQL to serial in the second attempt itself. And serial SQLs never report ORA 12842.  So, suppressing the error effectively means that your SQL will be downgraded to serial. And this will again have huge performance implications.

Now that we know how Oracle handles these kind of situations, we can make a careful choice on whether this fix control should be set. I'd personally advise against it. There are better ways to handle this error. Like, you could run the partition maintenance on weekends ( outside of your  normal OLTP/ batch reporting jobs).


Bloom Partition Pruning In Oracle Vs Postgres

In this blog post let's compare Oracle and Postgres optimizer transformation features.  For this test case I created two small tables an...